Cédric Beaume
Applied Mathematician
You are in Research > Dry lake patterns
Contact
c.m.l.beaume AT leeds.ac.uk
Dr. Cédric Beaume
School of Mathematics
University of Leeds
Leeds, LS2 9JT (UK)

Languages


Dry lake patterns
When the source of a lake is no longer capable of supplying water at a sufficient rate, the water level drops and may fall below the visible surface of the lake. The resulting depleted lakes are referred to as dry lakes and are a relatively common occurence in semi-arid regions, where evaporation can easily overwhelm weakening water sources.
The largest salt lake on Earth, Salar de Uyuni, occupies more than 10,000km^2 of the Bolivian Andes and its mezmerizing surface patterns (see Figure 1) attract nearly 80,000 tourists per year despite the lake's remote location. It is also a source of inspiration to the filming industry and featured, notably, as the exotic landscapes of planet Crait in Star Wars: The Last Jedi.
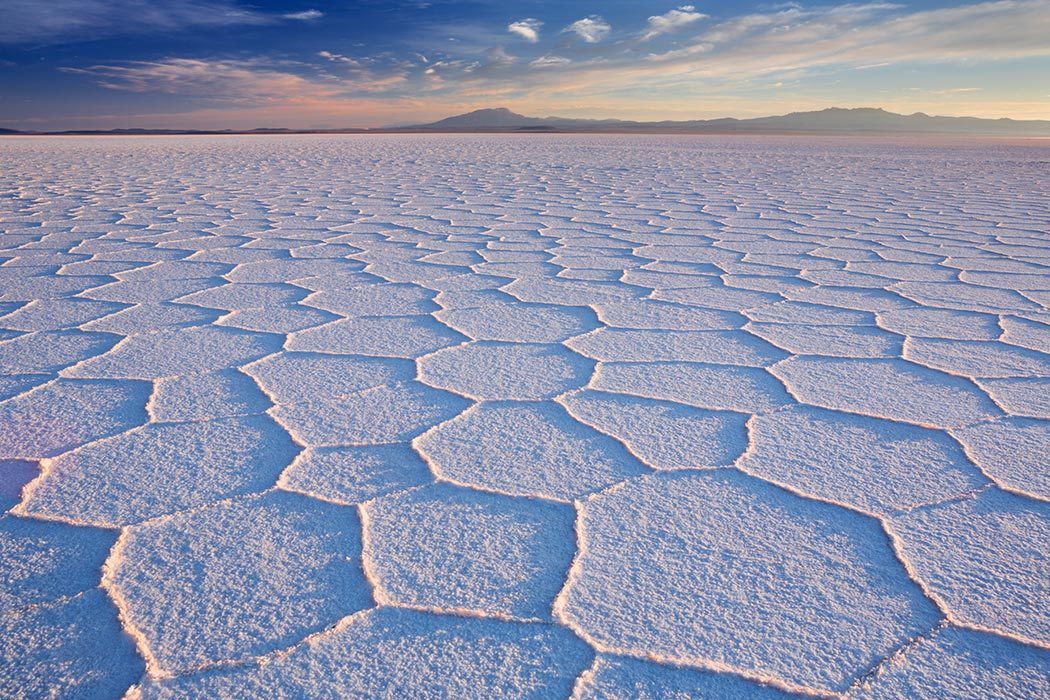
Figure 1: Photograph taken at Salar de Uyuni (Bolivia) showing the patterns formed at the surface of the lake crust. See this article.
The surface of dry lakes usually consists of a salty crust whose composition depends on the local geology. As the crust grows, its surface does not remain flat and ridges grow in a network of photogenic polygons. Owing to the dry nature of their crust and enhanced by its raised ridges, dry lakes produce considerable dust, some of which may represent a hazard to local populations.
Despite their name, dry lakes are driven, in a significant part, by fluid dynamics. The hot climates associated with semi-arid regions generate relatively high evaporation rates, which drive the lake water toward the surface. Dissolved minerals found deep below the surface are consequently transported by this flow and deposited into a surface crust as water evaporates. The fluid in the vicinity of this surface crust is saturated in minerals and, thus, heavier than the fluid deeper into the lake. As a result, a competing buoyancy force develops and the resulting dynamics is complex, giving rise to instabilities and to the formation of patterns similar to those observed at the surface of dry lakes (see Video 1).
Video 1: Development of an instability to patterns in a dry lake. The side views represent the salinity on vertical slices (yellow indicates that the fluid is saturated in mineral). The top view represent the salinity flux to the surface of the lake: red (resp. blue) indicates an upward (resp. downward) flux. Parameters are: lake depth 10; lake horizontal aspect-ratio 1; lake size 24π; Rayleigh number 100. Each second on the video corresponds to 0.1 time unit.
Collaborations
Dr. Lucas Goehring (Nottingham Trent University)
Mr. Matthew Threadgold (University of Leeds)
Prof. Steve Tobias (University of Leeds)